This guide explains how receivables work and why accounts receivable matters for business cash flow and investor analysis. “Receivables Investopedia” is used here as a framing point to discuss definitions, measurement, and risk controls. Background context covers how companies track invoices, convert sales to cash, and how investors interpret quality of receivables objectively.

For investors and operators alike, accounts receivable is not just an accounting line item—it’s a running forecast of when credit sales will become cash. In practical terms, receivables represent amounts owed by customers for goods or services already delivered, and they directly affect liquidity, credit risk, and earnings quality. When people search “Receivables Investopedia,” they are usually seeking a clear baseline definition and a framework for interpreting how well a business collects what it has billed.
From an industry perspective, the key analytical question is whether the receivables balance is collectible, timely, and appropriately reserved. A firm may record revenue correctly yet still struggle to convert that revenue into cash if customer payment behavior deteriorates, collections policies weaken, or terms become more permissive. That is why receivables analysis is often treated as an early warning indicator—sometimes even before margins compress.
What makes receivables especially important is that they connect multiple “worlds” inside a business: sales (who promised and billed), operations (what was delivered and when), finance (how and when the company recognizes revenue and estimates credit losses), and treasury/collections (how and when the company actually receives cash). When those worlds don’t align, receivables can become a pressure point—an indicator that performance is not flowing through the system the way investors expect.
In other words, receivables aren’t only about “money owed.” They are about timing—how long cash is delayed between service delivery and payment. Delays can be benign (seasonality, customer payment cycles), or they can reflect deeper issues (disputes, worsening credit quality, or ineffective collections). The same “A/R growth” can mean different things depending on context, which is why careful evaluation matters.
In corporate finance and financial statement analysis, receivables typically refers to amounts due from customers and other counterparties. The very common example is accounts receivable (A/R), which arises when a company sells on credit (rather than receiving payment immediately). The balance increases when invoices are issued and decreases when customers pay.
Although terminology can vary by industry and reporting practice, the underlying logic is consistent: receivables are the bridge between reported revenue and cash receipts. This bridge is affected by:
Depending on the business model, receivables can also include other “amounts due” beyond traditional A/R. For example, some companies have contract assets, notes receivable, or other receivable categories. Analysts often focus on the overall liquidity impact: what is expected to be collected soon, what is likely to be collected later, and what may never be collected without restructuring.
It’s also useful to recognize that receivables are not always “pure cash-like assets.” The existence of an invoice does not guarantee cash will arrive as expected. Receivables may be delayed due to administrative processes (customer approvals, procurement schedules), disputed due to quality or scope, or impaired due to customer financial stress. Accounting classifications may capture the receivable as an asset, but actual realizability depends on the customer and the enforceability of contractual rights.
Receivables influence both working capital and cash flow expectations. Even if a company is profitable on an accrual basis, large or growing A/R can indicate delayed cash conversion. Analysts often connect this to operational health through metrics such as:
When “Receivables Investopedia” is discussed in research, the expectation is usually that readers can interpret these ratios in context—because ratios without context can mislead. A seasonal retailer may naturally show higher A/R during peak periods; a B2B services firm may have longer billing cycles. The analytical task is to compare against the company’s own history, peers, and credit terms.
From a valuation standpoint, receivables can affect discounted cash flow (DCF) models and credit risk assessments. Many valuation frameworks rely on free cash flow, which depends not only on earnings but also on working capital changes. If earnings look healthy but receivables rise faster than sales, free cash flow can lag, which may reduce valuation or trigger covenant/financing concerns.
Receivables also matter for leverage and solvency perceptions. A firm with rising A/R but weak cash generation can look “financially constrained,” even if its income statement appears robust. In stressed scenarios, lenders may scrutinize the quality of assets supporting borrowing—receivables are often a key collateral component in credit facilities, especially where receivables financing (including factoring or securitization) is used.
There is also a behavioral element: management incentives can influence how receivables are managed. Sales teams may be rewarded for growth, while collections teams may be measured differently. Effective companies align these incentives to ensure growth does not “buy” revenue at the expense of cash conversion and collectability. Weak alignment can show up in a deteriorating A/R profile long before auditors adjust reserves.
Investors rarely stop at “how much A/R exists.” Industry practice emphasizes receivables quality, which includes collectability, aging patterns, and the realism of credit loss estimates. An expert approach typically looks for:
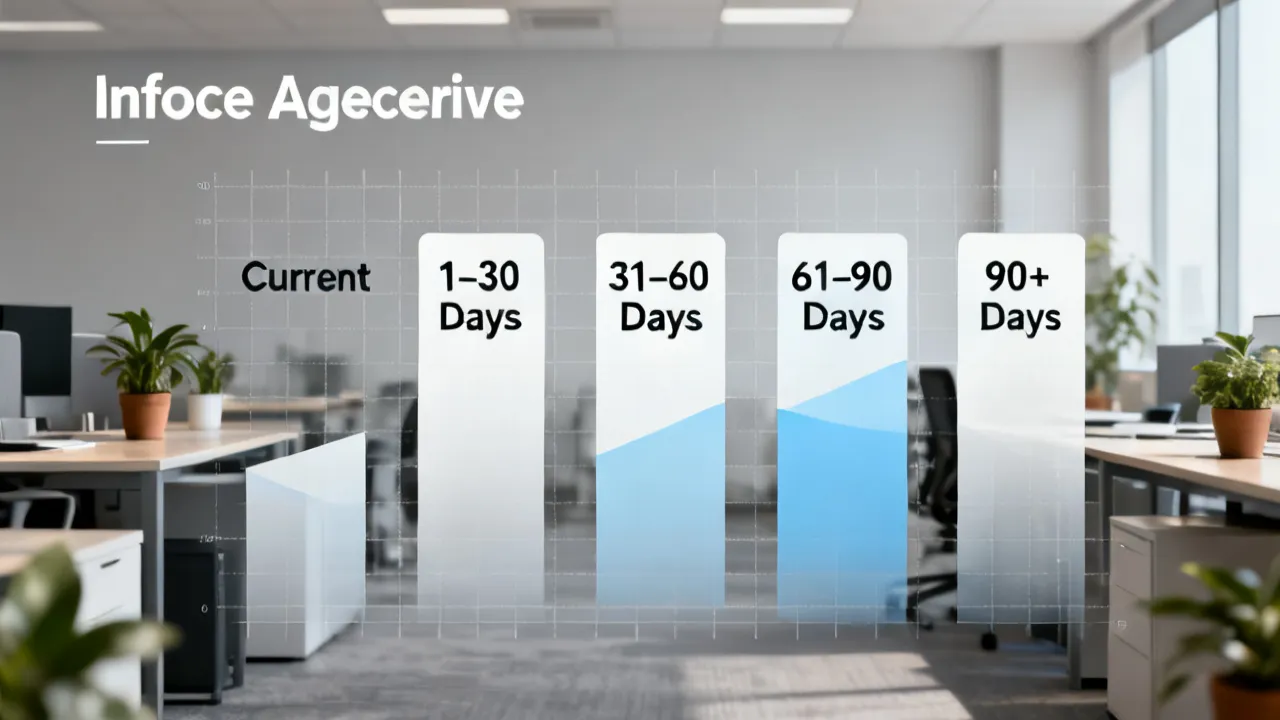
An aging schedule groups receivables by how long they have been outstanding (e.g., current, 30–60 days past due, 60–90, 90+). A stable business typically exhibits aging patterns consistent with its terms and customer mix. If a growing share of receivables shifts into older aging buckets, it can signal:
Investors often pay attention to the “90+” bucket and to trends in the “current” portion. An unusually low current portion relative to what the payment terms suggest can indicate either aggressive revenue recognition timing or broad collection delays. Of course, some industries have structural reasons for longer aging. For example, defense contracting, utilities, or government-related procurement can cause longer approval cycles. That’s why aging interpretation requires term knowledge.
Another nuance involves “lumpy” collections. A company with many small invoices may show relatively smooth DSO and aging movement. A company with fewer large customers may experience sudden shifts—one major payment can sharply reduce A/R and improve metrics. Therefore, an analyst may combine aging data with customer concentration and cash receipt history rather than relying on one period.
Investors also consider whether the aging pattern aligns with disclosures about credit risk and expected credit losses. If older aging rises but the allowance remains unchanged, the market may interpret it as under-reserving—potentially leading to future earnings hits when losses materialize.
Accounting standards require recognition of credit losses using an estimate methodology. Companies generally record an allowance (or expected credit loss allowance) based on historical loss experience, current conditions, and reasonable forecasts. Investors evaluate whether the allowance appears aligned with observed aging trends and macroeconomic conditions.
Importantly, an allowance that is too low can inflate profits, while an allowance that is too high can understate earnings and over-penalize cash flow expectations. The objective is not “maximum conservatism,” but consistency and reasonableness in estimation. For foundational reporting guidance, the IFRS 9 and ASC 326 frameworks are widely referenced in professional accounting practice.
There is a subtle but meaningful distinction between accounting outcomes and economic outcomes. A company may reserve appropriately under accounting rules, but still face cash constraints if collections are delayed (even if losses never fully materialize). Conversely, a company may show acceptable aging but later experience write-offs due to customer bankruptcy. That’s why investors treat the allowance as one signal among several—not a definitive proof of safety.
Investors also analyze allowance mechanics: how the allowance balance changes over time and how the company’s “provision for credit losses” and “net write-offs” reconcile. Many meaningful questions include: Are write-offs rising? Is the allowance replenished based on current conditions? Do reserves reverse when conditions improve? Are there meaningful recoveries? The quality of disclosure matters because it reveals how management thinks about credit risk.
Under expected credit loss models, companies may use reasonable and supportable information to predict credit losses. In practice, this often requires management judgment about forward-looking macro factors, customer behavior, and portfolio segmentation. Investors may try to understand whether those judgments look overly optimistic or whether they show discipline and responsiveness.
Because receivables are tied to billed sales, a mismatch between billing, delivery, and revenue recognition can create risk. If invoices are issued but underlying performance obligations are not satisfied, collectability may decline due to customer disputes. While this requires careful audit interpretation, an analyst should watch for:
Revenue recognition and receivables do not always move together because contracts can involve milestones, acceptance criteria, or performance obligations. For example, a company may deliver goods but invoice after installation verification. Another company may invoice upon shipment. Each model changes the timing between delivery, revenue recognition, and invoicing—affecting receivables timing.
Disclosures about contract assets, deferred revenue, and changes in contract terms can help analysts separate legitimate timing differences from problematic patterns. If the company’s receivables growth correlates with contract modifications, dispute-related adjustments, or changes in billing cadence, it may be more explainable than if it appears unrelated to operational shifts.
Investors therefore often seek “triangulation”: if revenue recognition is stable but receivables deteriorate, something in billing or collections may be off. If revenue recognition accelerates but receivables and cash diverge sharply, it may indicate that revenue growth is outpacing collection ability or that receivables may be at higher risk of impairment.
Behind every A/R balance is a set of operational decisions: who sets credit limits, how invoices are verified, how disputes are handled, and how quickly collections teams escalate delinquency. In many industries, especially B2B manufacturing, logistics, and professional services, the “receivables system” is a competitive capability.
For example, a supplier may offer favorable terms to retain large customers, but if payment performance deteriorates, the company might respond by tightening credit approval, shifting to deposits, using factoring selectively, or revising dispute resolution workflows. These actions often show up not only in A/R trends but also in margins (e.g., if financing costs rise) and customer relationships (e.g., if terms become less favorable).
Collections operations can also involve technology and process. Companies with integrated billing and order management may reduce invoice errors and disputes, improving cash conversion. Companies with fragmented systems may send invoices with errors, leading to delays while customers verify charges. In those cases, receivables are less about “credit risk” and more about “process risk.” Investors should interpret the signal accordingly.
Another important point is that credit policy is often a strategic choice. A company may deliberately extend terms to win share in a competitive market. That can be perfectly rational if the company expects customer retention and profitable long-term relationships. However, investors should see that the company understands the trade-off and manages the consequences—through appropriate reserves, disciplined collections, and liquidity planning.
Collections capabilities can also vary by customer segment. A company might handle disputes aggressively for smaller customers but rely on procurement relationships for major accounts. The structure of customer relationships matters. For instance, in public-sector or healthcare settings, payment timing may be governed by external schedules. In those contexts, aging might appear “worse” without implying that customers will ultimately fail to pay.
Below is a professional, objective way to interpret common patterns. None of these signals alone proves wrongdoing; context and corroboration matter.
To interpret these patterns more precisely, analysts often examine “cash receipts vs. sales timing.” For example, a company that recognizes revenue over time (as it performs) may still have A/R patterns that reflect invoicing milestones. If those milestones change, A/R can move even if underlying economic performance is stable. Similarly, if customers prepay or if the company transitions to more upfront billing, receivables may decrease—sometimes without any improvement in credit risk.
Another nuance is whether receivables are supported by collateral or by contractual protections. Some receivables are secured or guaranteed, or they may be tied to performance bonds or letters of credit. Those factors can reduce loss risk. Even if receivables are large, recoverability may be stronger if the company has robust legal enforceability.
Analysts also consider the possibility of channel stuffing or aggressive credit terms. While not always present, rapid A/R growth alongside weak or declining cash receipts and rising returns/disputes can be a red flag. The right approach is not to assume misconduct, but to identify whether multiple indicators align: aging deterioration, higher allowance provision, increased credit memo activity, or unusual customer concentration changes.
Conversely, receivables can rise during legitimate expansions: entering new markets, signing up customers with slower payment behavior, or ramping new contract types. Those legitimate expansions should still show management discipline—clear explanation in filings, stable allowance methodology, and gradually improving collections as the sales cycle stabilizes.
Even though the phrase “supplier details” is not accompanied by specific company names in your request, an expert analysis still treats the supplier–customer relationship as central. In many ecosystems, suppliers face credit concentration risks: a small number of large buyers can dominate A/R balances. If those buyers face financial stress, suppliers may experience rapid deterioration in collectability.
Practically, analysts examine whether:
Customer concentration matters not just because of potential nonpayment, but because of relationship dynamics. If a large buyer disputes invoices, it can block cash conversion for a large portion of the receivables portfolio. Smaller disputes may be absorbed, but disputes with major customers can delay collections and increase the need for reserves.
There is also a “reverse causality” issue: companies sometimes loosen credit terms in response to customer pressure. For example, a powerful customer might demand longer payment periods, forcing suppliers to finance working capital. If supplier management cannot pass the cost through pricing adjustments, receivables can become a hidden subsidy to customer cash flow.
In some industries, suppliers and customers both operate within a broader credit environment. Macro conditions influence customer insolvency probabilities, and receivables become an exposure channel for business cycles. Investors therefore integrate receivables analysis with macro indicators: unemployment, interest rate stress, credit spreads, and industry-specific downturn signals.
In addition, investors sometimes examine whether the company has taken steps to diversify credit risk. Examples include offering smaller balances across more customers, using credit insurance, requiring deposits for new accounts, or adjusting contract terms. When those actions are disclosed, it may explain why receivables dynamics change even if sales remain stable.
Below is a structured process for analyzing receivables in a way that is consistent across firms. It emphasizes repeatability and objective interpretation rather than one-off impressions.
To further strengthen the analysis, an investor may add one or two internal “sanity checks” even if they do not have full management data. For example, compare A/R growth with changes in deferred contract costs, contract assets, or billings. Also look at whether the company’s gross margin and returns or allowances for customer refunds align with any increase in disputes that could affect collectability.
Additionally, because receivables can be influenced by foreign currency translation (for globally operating companies), analysts often consider currency effects. A currency strengthening can inflate the reported A/R balance without representing actual economic deterioration. Similarly, acquisitions and divestitures can change portfolio characteristics and credit terms; investors should adjust for these structural events when interpreting trends.
The table below compares common receivables-related analytical approaches. It is designed to help readers map actions to evidence and conditions.
| Analytical approach | What it measures | Common evidence used | Conditions/requirements |
|---|---|---|---|
| DSO / receivables turnover review | How quickly receivables convert to cash | A/R balance, revenue, cash receipts timing, aging trends | Industry-cycle normalization; consistent revenue recognition and reporting cadence |
| Aging profile concentration check | Whether delinquency is increasing | Aging buckets, percentage of overdue receivables | Comparability of aging classifications; accounting cutoffs |
| Allowance adequacy assessment | Whether credit losses are estimated realistically | Allowance changes, write-offs, expected credit loss assumptions | Understand reserve methodology; reconcile with policy changes and loss history |
| Receivables vs. operating cash flow reconciliation | Whether accrual profit is translating into cash | Operating cash flow, working-capital components, collections timing | Look at multiple periods; consider temporary timing effects |
| Credit policy and collections capability review | Operational drivers of collectability | Management commentary, credit terms disclosures, dispute metrics if provided | Confirm policy consistency and whether changes were communicated |
Sources (standards and authoritative references): IFRS 9 for expected credit losses; U.S. GAAP ASC 326 for credit loss measurement for financial instruments; and general working capital/financial statement interpretation guidance from established accounting and securities regulation bodies such as the U.S. Securities and Exchange Commission (SEC) disclosure framework.
When readers mention “Receivables Investopedia,” it generally points to educational explanations of what receivables are and how they appear in financial statements. The risk with any single educational source is that readers may treat it as a universal rulebook. In real analysis, receivables should be evaluated alongside the company’s:
In other words, use educational definitions as a starting point, then graduate to evidence-driven interpretation using company reporting and standardized analytical methods.
Overfitting is a common pitfall in financial analysis: treating a single metric—like DSO increase—as a definitive indicator of misconduct or imminent default. But receivables metrics are heavily influenced by accounting cutoffs, billing cadence, seasonality, and customer mix. Even a strong company can show worse receivables when it transitions into longer-term contracts, expands into markets with different payment customs, or experiences a temporary collections backlog due to systems upgrades.
To avoid overfitting, analysts may build a “signal hierarchy.” The most credible signals usually involve multiple independent lines of evidence, such as (1) aging deterioration, (2) increased provision for credit losses, and (3) weak operating cash flow relative to profits. If only one indicator moves, the analysis should remain cautious.
Also, use the educational concept to ask better questions. For example, after learning what receivables represent, ask: Why did the company grant more credit? Is it because of growth strategy or because collections failed? Are disputes rising? Is there a meaningful shift in reserve methodology? These questions turn definitions into diagnosis.
Misconceptions persist partly because readers often see receivables through a simplified lens. In reality, A/R is an output of many processes: billing accuracy, contract terms, credit underwriting, dispute handling, collections cadence, and accounting judgment. Without understanding those processes, it’s easy to interpret receivables incorrectly.
Another reason misconceptions persist is that financial statements can obscure details. A company may not provide granular customer-level aging, and receivables may be net of allowances. As a result, outsiders may assume that reported balances are uniformly “collectible” or that the allowance fully captures impairment. Yet impairment can involve timing issues (slow payment) as well as credit losses (nonpayment). Those are different economic phenomena.
Finally, some misconceptions persist due to the ambiguity of “good” working capital. A company might manage receivables aggressively to boost cash flow at the expense of future growth if it tightens terms too much. Others might accept slower cash conversion for long-term strategic relationships. Both can be rational depending on context and pricing power. The right interpretation depends on whether management understands and controls the trade-offs.
For those conducting diligence, it’s helpful to maintain a checklist. While exact line items and disclosure wording vary, the objective evidence usually includes:
When filings clearly explain drivers (e.g., term changes, customer mix, or collection program improvements), investors can interpret receivables movements more confidently.
To make the checklist more operational, investors may also verify the “story consistency” between sections of the report. For example, management’s discussion of cash flow in the MD&A should align with the working capital changes in the statement of cash flows. If MD&A attributes cash shortfalls to temporary timing but the aging schedule shows a structural increase in overdue receivables, that inconsistency can signal that the explanation may be incomplete or optimistic.
Analysts can also compare receivables commentary across periods. Are management explanations stable? Do they change when new data appears? For instance, if management previously blamed seasonal collections but then shifts blame to “customer payment trends,” investors might infer that credit conditions are changing.
Another filing element is the presence of qualitative credit risk disclosures: information about significant concentrations of credit risk, credit quality indicators, and methods used to determine allowances. If a company provides enough detail to understand segmentation (e.g., by geography, customer type, or credit rating), investors can better assess whether reserve methodologies align with actual risk profiles.
Companies typically manage receivables risk using a combination of credit policy, monitoring, and legal protections. Common measures include:
From an expert standpoint, mitigation strategies should be evaluated for second-order effects. For instance, factoring can improve cash flow but may introduce fees and can affect leverage ratios or disclosure interpretation. The goal is to understand tradeoffs rather than treat any tool as universally beneficial.
Credit insurance can also be nuanced. It may not cover disputes, it may have exclusions, or claims may require waiting periods. If the insurance coverage is limited, investors should not assume that nonpayment risk is eliminated. Similarly, legal enforcement can be slower in certain jurisdictions. Therefore, receivables risk mitigation often involves time and process, not just formal credit protection.
Operational controls matter too. Invoice accuracy and clarity reduce disputes and shorten “time to resolution.” Strong controls around contract billing and delivery documentation help customers approve invoices faster. When companies invest in automation, better data quality, and integrated billing systems, they can reduce both credit risk and process risk, improving DSO and aging profiles.
Investors may look for evidence of process improvements through communications in filings or through recurring trends: reduced dispute-related adjustments, improving cash conversion despite stable revenue, or stable allowance levels despite industry headwinds.
Accounts receivable are amounts customers owe the company for goods or services already delivered, typically arising when payment is due after an invoice is issued.
Investors look at aging trends, the size and movement of the allowance for credit losses, whether cash receipts track accrual profits, and whether customer concentration or credit terms have changed.
A higher DSO often indicates slower collections or longer payment terms. However, it can also reflect business mix changes or temporary timing effects, so it should be reviewed alongside aging schedules and operating cash flow.
Yes. Accrual-based revenue can increase while cash conversion slows, causing working-capital stress and liquidity risk—especially if customer payment behavior deteriorates.
The allowance represents management’s estimate of expected credit losses. Changes in the allowance can affect reported earnings and help signal whether collectability assumptions are becoming more pessimistic or more conservative.
Start with trend analysis of A/R relative to revenue, review the aging schedule, then connect receivables movements to operating cash flow and the credit loss allowance policy.
Educational definitions are useful, but investing decisions require context-specific analysis using company disclosures, industry norms, and evidence such as aging, reserves, and cash flow reconciliation.
Receivables—often framed by educational resources such as “Receivables Investopedia”—are top understood as a measurable link between reported performance and future cash receipts. A professional approach combines definitions with evidence: aging profiles, allowance policies, cash conversion patterns, and operational credit/collections practices. When analysts integrate these elements, they can distinguish between ordinary working-capital variability and genuine deterioration in collectability.
Ultimately, disciplined receivables analysis helps investors and managers ask the right questions early: Are invoices collecting on schedule? Is credit risk rising faster than reserves? And is accrual profit translating into cash in a way consistent with the business model?
By treating receivables as a system—rather than a static number—stakeholders can better identify risks, understand the drivers behind cash conversion, and make decisions that reflect both accounting performance and economic reality.
Striking the Perfect Balance: Navigating Premiums and Out-of-Pocket Expenses in Senior Insurance Plans

Explore the Tranquil Bliss of Idyllic Rural Retreats

How to Make Lasting Memories at Disneyland Attractions

4rkojvsx Technology: Industry Insights and Buying Guide

Affordable Phones and Plans for Seniors

Affordable Full Mouth Dental Implants Near You

Unlock the Top Kept Secrets to Finding Your Ideal Dentist for Flawless Dental Implant Results!

Discovering Springdale Estates

Unveiling RS Sul Telecom Services


Digio Livelo Explained: Rewards Integration and Use
This guide explains how Digio Livelo works for earning and using rewards, what to verify before you start, and how to choose sensible redemption options. “Digio Livelo” refers to a rewards relationship between Digio’s digital banking/payment experience and Livelo’s loyalty ecosystem. Practically, it’s about matching your spending or engagement to reward accrual, then selecting redemptions that fit your goals.

Receivables Explained with Investopedia Insights and Risk Controls
This guide explains receivables fundamentals and how to manage them with evidence-based controls aligned with Investopedia-style definitions. It provides objective background on what “receivables” means in accounting, why aging matters, and how businesses assess credit exposure, collect payments, and protect cash flow without assumptions.

Accounts Receivable Guide: Investopedia Insights for Clarity
This guide explains how accounts receivable work, how they’re valued and managed, and how firms interpret them in decision-making. Background context covers the Receivables concept referenced by Investopedia, common risks like credit exposure and timing gaps, and the role of policies, documentation, and estimates such as allowances. The focus is practical and objective for analysts and operations leaders.

Receivables: How to Interpret and Manage Credit Risk
Receivables are the lifeblood of many businesses because they represent money owed by customers. This guide explains how receivables are analyzed, why payment terms matter, and how “Receivables Investopedia” concepts help standardize thinking about liquidity and credit risk. Objective background follows, centered on accounting definitions, risk signals, and common management practices.

Bambora Payfac: A Practical Guide for Merchants
Bambora Payfac helps merchants structure card and digital payments through a streamlined payment facilitation model. This objective guide explains what payment facilitation is, how onboarding and compliance typically work, and what merchants should evaluate—pricing transparency, risk controls, settlement timing, and operational responsibilities—so you can choose an approach that fits your business needs.
Understanding Accounts Receivable and Investopedia Insights
This guide explains how accounts receivable work, how to interpret “Receivables” definitions (including perspectives aligned with Investopedia), and how to manage invoice collections with disciplined policies. Accounts receivable refers to money customers owe from credit sales. It sits on the balance sheet as a current asset, and its quality affects cash flow, risk, and working-capital decisions.